Strat Signal Setup Scanner (60/D/W/M/Q) - Part 3** PLEASE READ BEFORE USING THIS INDICATOR **
This indicator is strictly for helping people like myself learn 'The Strat' method by Rob Smith. This indicator DOES NOT provide trading advice or trade entry signals!
This scanner is Part 3 only. Please use with Strat Signal Scanner's (60/D/W/M/Q) Part 1 and 2 for full function.
A demo video of this indicator is available:
Change indicators label color’s and adjust scanner window as required.
Intraday Strat Signal and Setup Scanner (5/15/30/60/D) - Part 1/2/3 version is also available.
Strat Signal and Setup Scanner (60/D/W/M/Q) - Part 1, 2 and 3 features:
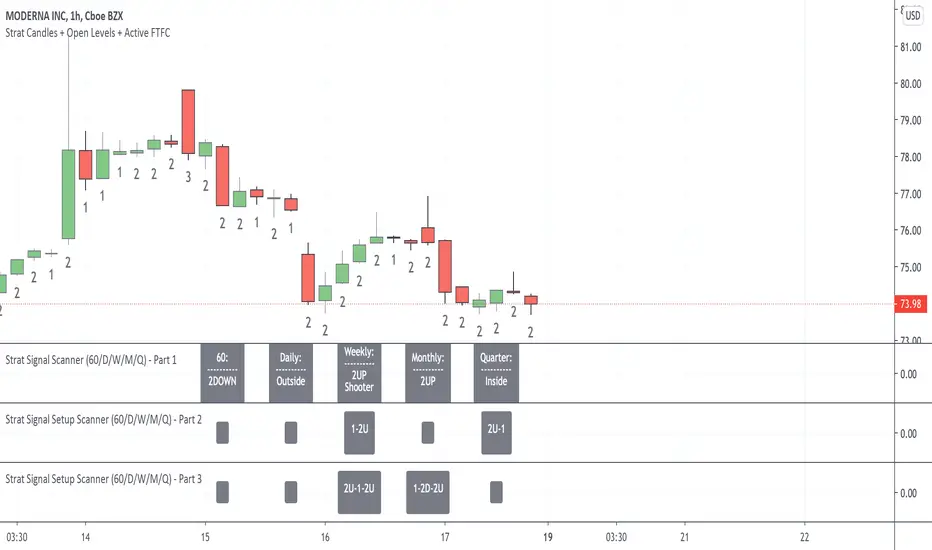
Strat Signal Scanner - Part 1 - (The Current bar’s condition with Hammer/Shooting Star combos if identified)
Inside Bar
2UP
2DOWN
Outside Bar
Shooting Star (signal will trigger when candle is forming live not after the candle has closed allowing you to prepare)
Hammer (signal will trigger when candle is forming live not after the candle has closed allowing you to prepare)
Shooter-Hammer (signal will trigger when pattern is forming live AND after both the Shooter and Hammer candles have closed giving you the new bar to action)
Hammer-Shooter (signal will trigger when pattern is forming live AND after both the Shooter and Hammer candles have closed giving you the new bar to action)
Strat Signal Setup Scanner - Part 2 - (Previous Bar + Current bar to identify setups)
2U-1
2D-1
3-1
1-2U
1-2D
1-3
3-2U
3-2D
Strat Signal Setup Scanner - Part 3 - (Previous two bars + Current bar to identify setups)
3-1-2U
3-1-2D
2U-1-2U
2D-1-2D
2U-1-2D
2D-1-2U
1-2U-2D
1-2D-2U
How to use the Strat Signal and Setup Scanner?
Open the 3 indicators in order starting with Part 1, Part 2 then Part 3. That way the scanner headings (60/D/W/M/Q) will line up with the setups signals.
IMPORTANT: For the scan to work across ALL Timeframe Groups (60/D/W/M/Q) successfully you must open a 1HR (60min) chart on the stock you want to scan.
Once the scan results are displayed with the 1HR chart open you can then click on a Daily, Weekly, Monthly or Quarter chart to see the setups. But do not pay attention to the new lower timeframe scan results when you have a higher timeframe chart open as they will be incorrect.
For an example: a Successful (60/D/W/M/Q) Scan = after you open a 1HR chart only. If you open the Daily chart the (D/W/M/Q) scan results will be correct but the 60 scan results will be incorrect. If you open the Weekly chart the (W/M/Q) results will be correct but the 60 and Daily scan results will be incorrect always go back to the 1HR chart to correct. This anomaly if due to a historical data issue with pine script.
How to change the Scanner Labels and Text Color’s?
Color’s changed within the Indicator Settings. After you choose your color's on the 'Inputs' page make sure you click the drop down arrow next to 'Defaults' (bottom left of the indicator settings) and then click 'Save As Default' to save your personalised indicator preferences.
How to create an Alert?
With a 1HR chart open click on Add Alert.
Change Condition to Strat Signal Scanner Part 1, Part or Part 3
Now select signal/setup in drop down box below example: ‘Inside 60’
Click Create
A Warning will appear now click ‘Continue anyway’. An alert is now set.
Поиск скриптов по запросу "inside bar"
Strat Signal Setup Scanner (60/D/W/M/Q) - Part 2** PLEASE READ BEFORE USING THIS INDICATOR **
This indicator is strictly for helping people like myself learn 'The Strat' method by Rob Smith. This indicator DOES NOT provide trading advice or trade entry signals!
This scanner is Part 2 only. Please use with Strat Signal Scanner's (60/D/W/M/Q) Part 1 and 3 for full function.
A demo video of this indicator is available:
Change indicators label color’s and adjust scanner window as required.
Intraday Strat Signal and Setup Scanner (5/15/30/60/D) - Part 1/2/3 version is also available.
Strat Signal and Setup Scanner (60/D/W/M/Q) - Part 1, 2 and 3 features:
Strat Signal Scanner - Part 1 - (The Current bar’s condition with Hammer/Shooting Star combos if identified)
Inside Bar
2UP
2DOWN
Outside Bar
Shooting Star (signal will trigger when candle is forming live not after the candle has closed allowing you to prepare)
Hammer (signal will trigger when candle is forming live not after the candle has closed allowing you to prepare)
Shooter-Hammer (signal will trigger when pattern is forming live AND after both the Shooter and Hammer candles have closed giving you the new bar to action)
Hammer-Shooter (signal will trigger when pattern is forming live AND after both the Shooter and Hammer candles have closed giving you the new bar to action)
Strat Signal Setup Scanner - Part 2 - (Previous Bar + Current bar to identify setups)
2U-1
2D-1
3-1
1-2U
1-2D
1-3
3-2U
3-2D
Strat Signal Setup Scanner - Part 3 - (Previous two bars + Current bar to identify setups)
3-1-2U
3-1-2D
2U-1-2U
2D-1-2D
2U-1-2D
2D-1-2U
1-2U-2D
1-2D-2U
How to use the Strat Signal and Setup Scanner?
Open the 3 indicators in order starting with Part 1, Part 2 then Part 3. That way the scanner headings (60/D/W/M/Q) will line up with the setups signals.
IMPORTANT: For the scan to work across ALL Timeframe Groups (60/D/W/M/Q) successfully you must open a 1HR (60min) chart on the stock you want to scan.
Once the scan results are displayed with the 1HR chart open you can then click on a Daily, Weekly, Monthly or Quarter chart to see the setups. But do not pay attention to the new lower timeframe scan results when you have a higher timeframe chart open as they will be incorrect.
For an example: a Successful (60/D/W/M/Q) Scan = after you open a 1HR chart only. If you open the Daily chart the (D/W/M/Q) scan results will be correct but the 60 scan results will be incorrect. If you open the Weekly chart the (W/M/Q) results will be correct but the 60 and Daily scan results will be incorrect always go back to the 1HR chart to correct. This anomaly if due to a historical data issue with pine script.
How to change the Scanner Labels and Text Color’s?
Color’s changed within the Indicator Settings. After you choose your color's on the 'Inputs' page make sure you click the drop down arrow next to 'Defaults' (bottom left of the indicator settings) and then click 'Save As Default' to save your personalised indicator preferences.
How to create an Alert?
With a 1HR chart open click on Add Alert.
Change Condition to Strat Signal Scanner Part 1, Part or Part 3
Now select signal/setup in drop down box below example: ‘Inside 60’
Click Create
A Warning will appear now click ‘Continue anyway’. An alert is now set.

Strat Signal Scanner (60/D/W/M/Q) - Part 1** PLEASE READ BEFORE USING THIS INDICATOR **
This indicator is strictly for helping people like myself learn 'The Strat' method by Rob Smith. This indicator DOES NOT provide trading advice or trade entry signals!
This scanner is Part 1 only. Please use with Strat Signal Scanner's (60/D/W/M/Q) Part 2 and 3 for full function.
A demo video of this indicator is available:
Change indicators label color’s and adjust scanner window as required.
Intraday Strat Signal and Setup Scanner (5/15/30/60/D) - Part 1/2/3 version is also available.
Strat Signal and Setup Scanner (60/D/W/M/Q) - Part 1, 2 and 3 features:
Strat Signal Scanner - Part 1 - (The Current bar’s condition with Hammer/Shooting Star combos if identified)
Inside Bar
2UP
2DOWN
Outside Bar
Shooting Star (signal will trigger when candle is forming live not after the candle has closed allowing you to prepare)
Hammer (signal will trigger when candle is forming live not after the candle has closed allowing you to prepare)
Shooter-Hammer (signal will trigger when pattern is forming live AND after both the Shooter and Hammer candles have closed giving you the new bar to action)
Hammer-Shooter (signal will trigger when pattern is forming live AND after both the Shooter and Hammer candles have closed giving you the new bar to action)
Strat Signal Setup Scanner - Part 2 - (Previous Bar + Current bar to identify setups)
2U-1
2D-1
3-1
1-2U
1-2D
1-3
3-2U
3-2D
Strat Signal Setup Scanner - Part 3 - (Previous two bars + Current bar to identify setups)
3-1-2U
3-1-2D
2U-1-2U
2D-1-2D
2U-1-2D
2D-1-2U
1-2U-2D
1-2D-2U
How to use the Strat Signal and Setup Scanner?
Open the 3 indicators in order starting with Part 1, Part 2 then Part 3. That way the scanner headings (60/D/W/M/Q) will line up with the setups signals.
IMPORTANT: For the scan to work across ALL Timeframe Groups (60/D/W/M/Q) successfully you must open a 1HR (60min) chart on the stock you want to scan.
Once the scan results are displayed with the 1HR chart open you can then click on a Daily, Weekly, Monthly or Quarter chart to see the setups. But do not pay attention to the new lower timeframe scan results when you have a higher timeframe chart open as they will be incorrect.
For an example: a Successful (60/D/W/M/Q) Scan = after you open a 1HR chart only. If you open the Daily chart the (D/W/M/Q) scan results will be correct but the 60 scan results will be incorrect. If you open the Weekly chart the (W/M/Q) results will be correct but the 60 and Daily scan results will be incorrect always go back to the 1HR chart to correct. This anomaly if due to a historical data issue with pine script.
How to change the Scanner Labels and Text Color’s?
Color’s changed within the Indicator Settings. After you choose your color's on the 'Inputs' page make sure you click the drop down arrow next to 'Defaults' (bottom left of the indicator settings) and then click 'Save As Default' to save your personalised indicator preferences.
How to create an Alert?
With a 1HR chart open click on Add Alert.
Change Condition to Strat Signal Scanner Part 1, Part or Part 3
Now select signal/setup in drop down box below example: ‘Inside 60’
Click Create
A Warning will appear now click ‘Continue anyway’. An alert is now set.

TrendPredator ESThe TrendPredator Essential (ES)
Stacey Burke, a seasoned trader and mentor, developed his trading system over the years, drawing insights from influential figures such as George Douglas Taylor, Tony Crabel, Steve Mauro, and Robert Schabacker. His popular system integrates select concepts from these experts into a consistent framework. While powerful, it is highly discretionary, requiring significant real-time analysis, which can be challenging for novice traders.
The TrendPredator ES indicator supports this approach by automating the essential analysis required to trade the system effectively and incorporating a mechanical bias and multi-timeframe concept.
It provides value to traders by significantly reducing the time needed for session preparation and offering relevant chart analysis and signals for live trading through real-time updates and a unique consolidated table format.
The Stacey Burke Master Pattern
Inspired by Taylor’s 3-day cycle and Steve Mauro’s work with “Beat the Market Maker,” Burke’s system views markets as cyclical, driven by the manipulative patterns of market makers. These patterns often trap traders at the extremes of moves above or below significant levels with peak formations, then reverse to utilize their liquidity, initiating the next phase. Breakouts away from these traps often lead to range expansions, as described by Tony Crabel and Robert Schabacker. After multiple consecutive breakouts, especially after the psychological number three, overextension might develop. A break in structure may then lead to reversals or pullbacks. Burke’s system is designed to track these cycles on the daily timeframe and provides signals and trade setups to navigate along them.
Bias Logic and Multi-Timeframe Concept
The indicator covers the basic signals of his system:
- First Red Day (FRD): Bearish break in structure, signalling weak longs in the market.
- First Green Day (FGD): Bullish break in structure signalling weak shorts in the markt.
- Three Days of Longs (3DL): Overextension signalling potential weak longs in the market.
- Three Days of Shorts (3DS): Overextension signalling potential weak shorts in the market.
- Inside Day (ID): Contraction, signalling potential impulsive reversal or range expansion move.
It enhances the original system by introducing:
Structured Bias Logic:
Tracks bias by following how price trades concerning the last previous candle high or low that was hit. For example if the high was hit, we are bullish above and bearish below.
- Bullish state: Breakout (BO), Fakeout Low (FOL)
- Bearish state: Breakdown (BD), Fakeout High (FOH)
Multi-Timeframe Perspective:
- Tracks all signals across H4, H8, D, W, and M timeframes, to look for alignment and follow trends and momentum in a mechanical way.
The indicator monitors the bias and signals of the system across all relevant timeframes and automates the related graphical chart analysis to generate the information needed for the trader to identify key setups. Additional to the SB pattern, the system helps to identify the higher timeframe situation and follow the moves driven by other timeframe traders.
Example: Full Bullish Cycle on the Daily Timeframe with Signals
- The Trap/Peak Formation
The market breaks down from a previous day’s and maybe week’s low—potentially after multiple breakdowns—but fails to move lower and pulls back up to form a peak formation low and closes as a first green day.
Signal: Bullish daily and weekly fakeout low; three consecutive breakdown days (1W Curr FOL, 1D Curr FOL, BO 3S).
- Pullback and Consolidation
The next day pulls further up after first green day signal, potentially consolidates inside the previous day’s range.
Signal: Fakeout low and first green day closing as an inside day (1D Curr IS, Prev FOL, First G).
- Range Expansion/Trend
The following day breaks up through the previous day’s high, launching a range expansion away from the trap.
Signal: Bullish daily breakout of an inside day (1D Curr BO, Prev IS).
- Overextension
After multiple consecutive breakouts, the market reaches a state of overextension, signalling a possible reversal or pullback.
Signal: Three days of breakout longs (1D Curr BO, Prev BO, BO 3L).
Note: This is only one possible scenario; there are many variations and combinations.
Example Chart: Full Bullish Cycle with Correlated Signals
Note: The signals shown along the move are manually added illustrations. The indicator shows these in realtime in the table at the bottom right. This is only one possible scenario; there are many variations and combinations.
Due to the fractal nature of markets, this cycle can be observed across timeframes. The strongest setups show multi-timeframe alignment. For example, a peak formation and potential reversal on the daily timeframe has high probability and follow-through if it also aligns with bearish signals on higher timeframes (e.g., weekly/monthly BD/FOH) and confirmation on lower timeframes (H4/H8 FOH/BD). With this perspective the system enables the trader to follow the trend and momentum and identify rollover points in a very differentiated way.
Detailed Features and Options
1. Historic Highs and Lows
Displays historic highs and lows per timeframe for added context, enabling users to track sequences over time.
Timeframes: H4, H8, D, W, M
Options: Customize for timeframes shown, number of historic candles per timeframe, colors, formats, and labels.
2. Previous High and Low Extensions
Displays extended previous levels (high, low, and close) for each timeframe to assess how price trades relative to these levels.
H4: P4H, P4L, P4C
H8: P8H, P8L, P8C
Daily: PDH, PDL, PDC
Weekly: PWH, PWL, PWC
Monthly: PMH, PML, PMC
Options: Fully customizable for timeframes shown, colors, formats, and labels.
3. Breach Lines
Tracks live market reactions (e.g., breakouts or fakeouts) per timeframe for the last previous high or low that was hit, highlighting these levels originating at the breached candle to indicate bias (color-coded).
Red: Bearish below
Green: Bullish above
H4: 4FOL, 4FOH, 4BO, 4BD
H8: 8FOL, 8FOH, 8BO, 8BD
D: dFOL, dFOH, dBO, dBD
W: wFOL, wFOH, wBO, wBD
M: mFOL, mFOH, mBO, mBD
Options: Fully customizable for timeframes shown, colors, formats, and labels.
4. Multi-Timeframe Table
Provides a real-time view of system signals, including:
Current Timeframe (Curr): Bias states.
- Breakout (green BO): Bullish after breaking above the previous high.
- Fakeout High (red FOH): Bearish after breaking above the previous high but pulling back down.
- Breakdown (red BD): Bearish after breaking below the previous low.
- Fakeout Low (green FOL): Bullish after breaking below the previous low but pulling back up.
- Inside (IS): Price trading neutral inside the previous range, taking the previous bias (color indicates the previous bias).
Previous Timeframe (Prev): Tracks last candle bias state and transitions dynamically.
- Bias for last candle: BO, FOH, BD, FOL in respective colors.
- Inside bar (yellow IS): Indicated as standalone signal.
Note: Also previous timeframes get constantly updated in real time to track the bias state in relation to the level that was hit. This means a BO can still lose the level and become a FOH, and vice versa, and a BD can still become a FOL, and vice versa. This is critical to see for example if traders that are trapped in that timeframe with a FOH or FOL are released. An inside bar stays fixed, though, since no level was hit in that timeframe.
Breakouts (BO): Breakout count 3 longs and 3 shorts.
- 3 Longs (red 3L): Bearish after three breakouts without hitting a previous low.
- 3 Shorts (green 3S): Bullish after three breakdowns without hitting a previous high.
First Countertrend Close (First): Tracks First Red or Green Day.
- First Green (G): After two consecutive red closes.
- First Red (R): After two consecutive green closes.
Options: Customizable font size and label colors.
Overall Options:
Toggle single feature groups on/off.
Customize H8 open/close time as an offset to UTC to be provider independent.
Colour settings for dark or bright backgrounds.
Using the Indicator for Trading
The automated analysis provided by the indicator can be used for thesis generation in preparation for a session as well as for live trading, leveraging the real-time updates. It is recommended to customize the settings accordingly, such as hiding the lower timeframes for thesis generation to keep the charts clean.
1. Setup Identification:
Follow the bias of daily and H8 timeframes. A setup always requires alignment of these.
Setup Types:
- Trend Trade: Trade in alignment with the previous day’s trend.
Example: Price above the previous day’s high → Focus on long setups (dBO, H8 FOL) until overextension or reversal signs appear (H8 BO 3L, First R).
- Reversal Trade: Identify reversal setups when lower timeframes show rollovers after higher timeframe weakness.
Example: Price below the previous day’s high after FOH → Look for reversal signals at the current high of day (H8 FOH, BO 3L, First R).
2. Context Assessment:
Evaluate alignment of higher timeframes (e.g., Month/Week, Week/Day). More alignment → Stronger setups. Conflicting situations → Setups invalidated.
3. Entry Confirmation:
Confirm entries based on H8 and H4 alignment and candle closes (e.g., M15 or M5 close after entering setup zone as confirmation).
Example Chart for Reversal Trade:
1. Setup Identification: FOH continuation after BO 3L overextension, confirmed by H8 FOH, First R.
2. Context Assessment: Month in FOL with bearish First R; Week in BO but bearishly overextended with BO 3L.
3. Entry Confirmation: H4 BD, M5 close.
Further recommendations:
- Higher timeframe context: TPO or volume profile indicators can be used to gain an even better overview.
- Entry confirmation: Momentum indicators like VWAP, Supertrend, or EMA are helpful for increasing precision. Additionally, tracking lower timeframe fakeouts can provide powerful confluence.
- Late session trading: Entries later in the session, such as during the 3rd hour of the NY session, offer better analysis and follow-through on setups.
Limitations:
Data availability using TradingView has its limitations. The indicator leverages only the real-time data available for the specific timeframe being used. This means it cannot access data from timeframes lower than the one displayed on the chart. For example, if you are on a daily chart, it cannot use H8 data. Additionally, on very low timeframes, the historical availability of data might be limited, making higher timeframe signals unreliable.
To address this, the indicator automatically hides the affected columns in these specific situations, preventing false signals.
Disclaimer
This indicator is for educational purposes only and does not guarantee profits.
None of the information provided shall be considered financial advice.
The indicator does not provide final buy or sell signals but highlights zones for potential setups.
Users are fully responsible for their trading decisions and outcomes.

HBK Price Action Strategy HBKPrice Action Strategy for XAUUSD with a Favorable Risk-Reward Ratio
Understanding the Strategy:
This strategy leverages price action principles to identify potential entry and exit points for XAUUSD on a 5-minute timeframe. The core idea is to identify price action patterns that suggest a high probability of a particular direction, and then to set stop-loss and take-profit levels to manage risk and reward.
Key Price Action Patterns to Watch:
Pin Bar: A pin bar is a candlestick with a long wick in one direction and a small body in the opposite direction. It often signals a reversal in the current trend.
Inside Bar: An inside bar forms when the current candle's high is lower than the previous candle's high, and the current candle's low is higher than the previous candle's low. It often indicates indecision or a potential breakout.
Engulfing Pattern: An engulfing pattern occurs when the current candle completely engulfs the previous candle. A bullish engulfing pattern signals a potential uptrend, while a bearish engulfing pattern signals a potential downtrend.
Risk-Reward Ratio:
A favorable risk-reward ratio is crucial for long-term trading success. Aim for a minimum risk-reward ratio of 1:2, meaning you risk $1 to potentially gain $2.
Entry and Exit Signals:
Long Entry:
Identify a bullish pin bar or engulfing pattern.
Wait for a confirmation candle to close above the pin bar's high or the engulfing pattern's high.
Place a stop-loss below the recent swing low.
Set a take-profit target at a key resistance level or a multiple of the stop-loss distance.
Short Entry:
Identify a bearish pin bar or engulfing pattern.
Wait for a confirmation candle to close below the pin bar's low or the engulfing pattern's low.
Place a stop-loss above the recent swing high.
Set a take-profit target at a key support level or a multiple of the stop-loss distance.
Additional Tips:
Use Support and Resistance Levels: Identify key support and resistance levels to set your stop-loss and take-profit targets.
Consider Market Sentiment: Pay attention to market sentiment and news events that may impact gold prices.
Manage Risk: Always use stop-loss orders to limit potential losses.
Be Patient: Don't force trades. Wait for high-probability setups.
Practice Discipline: Stick to your trading plan and avoid impulsive decisions.
Remember:
Price action trading requires practice and patience.
Backtest your strategy on historical data to refine your approach.
Always adapt to changing market conditions.
By following these guidelines and practicing disciplined risk management, you can increase your chances of success in trading XAUUSD on a 5-minute timeframe.

Gann swings [promuckaj]This indicator is a tool that could help the users what the market trend is at any time, based on legendary trader, Mr. William D. Gann .
Gann it self called this the “Trendline Indicator”, but modern traders call it Swing.
Gann’s primary use his techniques in correlation with this trading tool helping him achieve his phenomenal trading results.
Gann swings automatically displays the swing chart and trend on any timeframe you choose. There is option to set desired color and width of the trend line.
There is 3 types of settings to determine the swings, from 1 to 3 which represent the number of bars as confirmation for the swing bar. Default is 2.
There is labels on bars that gives information about each bar, is it up, down, inside or outside bar. This can be turned off/on.
🡱 - Up bar
🡳 - Down bar
⬍ - Outside bar
x - Inside bar
Indicator is also fully customizable to display break-out lines, which indicate potential trend changes ahead of time. There is option to choose whether you want to mark only first breaks in a row or you want all of them in case there is multiple ones in the same direction.
Gann swings is an indicator that EVERY trader and investor should have, it can provide vital information that can help to determine the trend of any market and information about the upswings and downswings.
Everyone enjoy trading !
P.S.:
I have in my mind some additional features as upgrade that can include data about each swing, like data for tops/bottoms date, time, price, range in % between swings, and bar count of each swing that is formed on the chart.

NR-VP-Period with VAH/VAL V.1.0Description
This indicator combines several useful trading tools into one package so you don’t need to load multiple scripts on your chart. It includes a built-in lot size calculator, session high-low zones, a custom volume profile with VPOC, VAH and VAL, previous-day high/low levels, pivot points and inside-bar detection. Each feature has its own on/off switch so you can keep the chart as clean or detailed as you want.
1. Lot Size Calculator
The script calculates position size based on your entry price, stop loss, account balance and risk percentage. It identifies whether the setup is a buy or sell and displays the results in a compact table on the chart, including SL distance in pips, risk amount and the final lot size.
2. Session High-Low Boxes
It draws high, low and mid lines for three intraday sessions: Asia, Midnight and London. Each session creates a dynamic box on the chart with optional extended lines to highlight future reaction levels. All colors and time windows can be customized.
3. Volume Profile with VPOC / VAH / VAL
The script calculates a multi-day volume profile at a custom resolution. It shows the VPOC line, the highest and lowest prices within the profile range, and the value area boundaries (VAH and VAL) based on your chosen percentage. Optional horizontal volume bars can be added for extra clarity. All elements can be toggled on or off.
4. Daily High and Low
It plots the previous day’s high and low with fully adjustable colors and line width. The levels update automatically and extend across the chart.
5. Pivot Points
The indicator detects automatic swing highs and lows (pivot points) using a configurable left/right length. Each pivot is marked with a small label and an extended dotted line.
6. Inside Bar Highlights
The script includes an inside bar detection system so you can visually track potential breakout or compression zones.

Body-Based Inside/Outside Bars (wicks excluded)This indicator shows inside/outside bars EXCLUDING the wicks. The yellow vertical line indicates an inside bar (body only) and the blue vertical line indicates outside bars (candle body only).

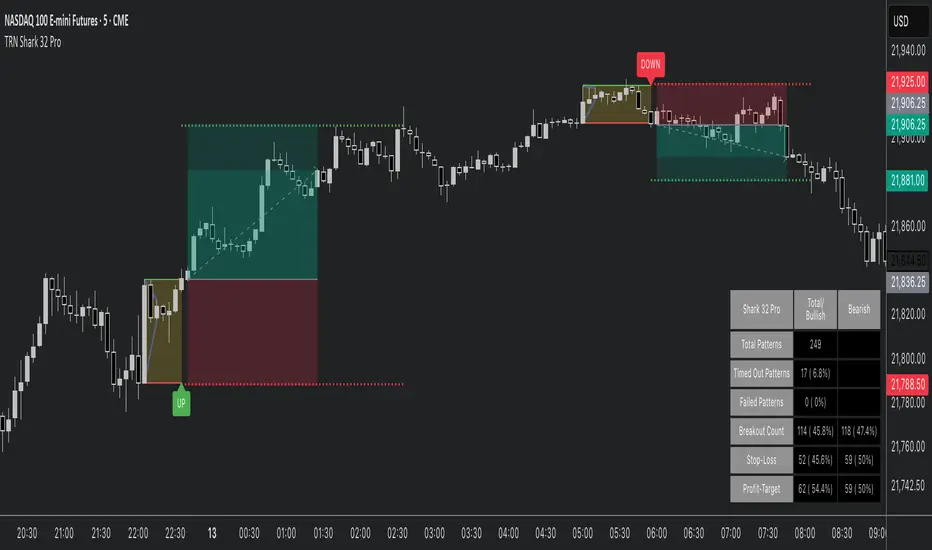
Shark 32 Pattern ProHello Traders!
The Shark32 pattern comprises multiple inside bars —each candle’s high/low is contained within the previous candle’s range—creating a tight consolidation zone. Once price breaks out, volatility frequently expands, producing sharper moves. The pattern is known for its relatively high continuation rate and the ability to offer tight risk/reward setups. It also calculates statistics, highlights stop/target levels, and offers fully customizable visuals so you can adapt the tool to your trading style.
Key Features :
Detects Shark 32 With Unlimited Inside Bars:
Automatically spots consecutive inside candles (not limited to just two), enabling you to catch more nuanced patterns.
Highlights Breakout:
Clear visual lines and labels mark where price breaks above/below the pattern boundary.
Stop-Loss & Profit Targets:
Draws a suggested stop-loss line and a projected target line, helping you manage risk and set profit objectives quickly.
Statistics & Analysis:
A built-in statistics table tracks pattern frequency, breakouts, stop-hits, target-hits, and more—helping you refine your strategy over time.
Fully Customizable Visuals:
Control line styles, colors, breakout labels, box fill, and more to fit your preference or chart theme.
Quick Resolutions:
This pattern forms fast and typically resolves within just a few bars, appealing to short-term traders.
Statistics at a Glance (based on Bulkowski's studies):
Continuation Bias : ~60% continuation bias.
Measured Move : 70%+ of bullish breakouts (in bull markets) reach the measured move.
Throwback : ~64% chance price retraces to the breakout level after an upside break.
Trend Alignment : Historically, success rates improve when trading in line with the larger trend.
How to Trade with This Indicator :
Identifying the Pattern : Wait till a Shark 32 pattern is formed.
Entry Rule : Enter on a confirmed close above the pattern high (for bullish) or below the pattern low (for bearish).
Stop Placement : Place stops a few ticks beyond the opposite side of the pattern. Tight ranges = small risk. Or use the mid-range of the pattern as a stop level.
Target Options : Aim for Risk/Reward Ratio of 2R or 3R to capture a strong follow-through. Alternatively, use the measured move of the first bar's height as a target.
Tips for Better Reliability:
Trend Alignment : Shark 32 breakouts usually work best in the direction of the broader market or trend.
Confirmation : Look for a significant volume increase at the breakout—helps filter out “fake” moves.
Throwback Awareness : ~64% of upside breakouts retest the pattern boundary; stay patient if you see a pullback.
Risk Management : Maintain tight stops and consider using alerts for activation/breakout signals.
Why This Indicator?
Clear Visuals : Highlights the pattern boundary, breakout lines, and potential stop/target levels.
Customizable : Lets you adjust line styles, risk parameters, alerts, and statistics display.
Statistical Edge : Built-in table aggregates pattern counts, success/failure rates, and average durations.
Final Thoughts:
This Shark 32 Pro indicator gives you a systematic way to spot—and trade—a compact yet powerful three-candle formation. Combine it with solid risk management and trend analysis for best results. Monitor volume and confirm breakouts with a candle close beyond the pattern’s range. While the pattern can fail, tight stops and clear targets help keep your trading efficient and disciplined.
Higher Time Frame Fair Value Gap [ZeroHeroTrading]A fair value gap (FVG) highlights an imbalance area between market participants, and has become popular for technical analysis among price action traders.
A bullish (respectively bearish) fair value gap appears in a triple-candle pattern when there is a large candle whose previous candle’s high (respectively low) and subsequent candle’s low (respectively high) do not fully overlap the large candle. The space between these wicks is known as the fair value gap.
The following script aims at identifying higher timeframe FVG's within a lower timeframe chart. As such, it offers a unique perspective on the formation of FVG's by combining the multiple timeframe data points in the same context.
You can change the indicator settings as you see fit to achieve the best results for your use case.
Features
It draws higher timeframe bullish and bearish FVG's on the chart.
For bullish (respectively bearish) higher timeframe FVG's, it adds the buying (respectively selling) pressure as a percentage ratio of the up (respectively down) volume of the second higher timeframe bar out of the total up (respectively down) volume of the first two higher timeframe bars.
It adds a right extended trendline from the most recent lowest low (respectively highest high) to the top (respectively bottom) of the higher timeframe bullish (respectively bearish) FVG.
It detects and displays higher timeframe FVG's as early as one starts forming.
It detects and displays lower timeframe (i.e. chart's timeframe) FVG's upon confirmation.
It allows for skipping inside first bars when evaluating FVG's.
It allows for dismissing higher timeframe FVG's if there is no update for any period of the chart's timeframe. For instance, this can occur at lower timeframes during low trading activity periods such as extended hours.
Settings
Higher Time Frame FVG dropdown: Selects the higher timeframe to run the FVG detection on. Default is 15 minutes. It must be higher than, and a multiple of, the chart's timeframe.
Higher Time Frame FVG color select: Selects the color of the text to display for higher timeframe FVG's. Default is black.
Show Trend Line checkbox: Turns on/off trendline display. Default is on.
Show Lower Time Frame FVG checkbox: Turns on/off lower timeframe (i.e. chart's timeframe) FVG detection. Default is on.
Show Lower Time Frame FVG color select: Selects the color of the border for lower timeframe (i.e. chart's timeframe) FVG's. Default is white.
Include Inside Bars checkbox: Turns on/off the inclusion of inside first bars when evaluating FVG's. Default is on.
With Consistent Updates checkbox: Turns on/off consistent updates requirement. Default is on.

Inside Candle alert V1 By HARSH DEO SINGHA breakout long signal is generated when the current high crosses above the previous mother bar's high, and it's an inside bar.
A breakdown short signal is generated when the current low crosses below the previous mother bar's low, and it's an inside bar.
The script plots triangle shapes below breakout long signals and above breakdown short signals.
Alert conditions are added for inside bars, breakout long, and breakdown short.
Please note that this is a basic example, and you can further refine and optimize your strategy based on your specific trading rules and preferences. Always remember to backtest and paper trade any strategy before using it with real money.


Trend lines indicator by ForexBeeEnhanced 3-Swing Trendline Zones - Complete Feature Guide
WHAT THIS INDICATOR DOES
This indicator automatically draws trendline zones on your chart using a 3-point validation system. Instead of just connecting any two price points like basic trendline tools, it waits for three swing points to confirm the trendline is valid before drawing it.
FEATURE 1: SWING POINT DETECTION
What it detects:
Swing highs: Price points where the high is higher than surrounding candles
Swing lows: Price points where the low is lower than surrounding candles
These show up as small arrows on your chart labeled "SH" (swing high) and "SL" (swing low)
Settings that control this:
Swing Length : Default is 6, range 1-20
Higher numbers = fewer, more significant swing points
Lower numbers = more swing points, including minor ones
Example: Setting 5 means each swing point must be higher/lower than 5 candles on each side
How to use this setting:
On 1-minute charts: Use 5-10 to filter out noise
On daily charts: Use 2-3 for more sensitivity
Volatile markets: Increase the number
Quiet markets: Decrease the number
Please See the Below Images To See the difference of swing length of 6 and 8
Display control:
Show Swing Points : Turn the arrows on/off
Default: ON (you'll see the arrows)
Turn OFF if arrows clutter your chart
FEATURE 2: RETRACEMENT VALIDATION SYSTEM
What this does:
After finding two swing points, the system checks if the second swing represents a proper market retracement, not just random price movement.
How it works:
Finds the highest point between two swing lows (or lowest point between two swing highs)
Calculates how much the second swing retraced from this extreme point
Only accepts swings that retrace between your set percentages
Settings that control this:
Lower Limit % : Default 50%, range 0-100%
Upper Limit % : Default 90%, range 0-100%
These create a "valid retracement zone"
Why this matters:
Eliminates random trendlines that don't follow market structure
Ensures trendlines represent actual retracement patterns
Based on Elliott Wave and Fibonacci principles
FEATURE 3: ATR-BASED ZONE WIDTH
What ATR means:
Average True Range measures how much price typically moves in a given period. Instead of fixed-width trendlines, this creates zones that adapt to market volatility.
Settings that control this:
Zone Width (ATR Multiple) : Default 0.3, range 0.1-1.0
ATR Length : Default 14, range 1-50 periods
How zone width works:
Multiplier 0.1 = Very narrow zones (tight around trendline)
Multiplier 0.5 = Medium zones
Multiplier 1.0 = Wide zones (accommodates more price movement)
ATR Length explained:
14 periods = Uses last 14 candles to calculate average volatility
Shorter periods (7) = More sensitive to recent volatility changes
Longer periods (21) = Smoother, less sensitive to volatility spikes
Practical impact:
During high volatility: Zones automatically become wider
During low volatility: Zones automatically become narrower
Prevents false breakouts during normal market noise
Creates realistic support/resistance areas instead of precise lines
FEATURE 4: VISUAL ZONE SYSTEM
Active Uptrend Zones:
Green upper boundary line (solid, thick)
Lime green lower boundary line (solid, thick)
Green fill between lines (80% transparency)
These represent dynamic support levels
Active Downtrend Zones:
Blue upper boundary line (solid, thick)
Navy blue lower boundary line (solid, thick)
Red fill between lines (80% transparency)
These represent dynamic resistance levels
Broken/Expired Zones:
Gray/silver boundary lines (dashed, thick)
Original fill color maintained (green for uptrend zones, red for downtrend zones)
Shows historical trendlines that are no longer active
FEATURE 5: BREAK DETECTION SYSTEM
How breaks are detected:
The system monitors when price violates the zone boundaries, indicating the trendline structure has failed.
Settings that control this:
Use Wick Break : True/False toggle
TRUE: Break occurs when candle high/low touches zone boundary
FALSE: Break occurs when candle close price crosses zone boundary
Conservative vs Aggressive approach:
Wick Break = TRUE (Aggressive) :
- More sensitive, earlier signals
- May produce more false breaks during volatile periods
- Good for scalping and short-term trading
Wick Break = FALSE (Conservative) :
- Requires candle to close beyond zone
- Fewer false signals, more reliable breaks
- Better for swing trading and position trading
What happens when zone breaks:
Zone lines change from solid to dashed
Zone lines change color to gray/silver
Fill color remains original (green/red) for identification
Zone stops extending forward
Zone is removed from active monitoring
FEATURE 6: ZONE EXPIRATION SYSTEM
What expiration does:
Allows trendlines to automatically become inactive after a set number of bars, even if they haven't been broken.
Settings that control this:
Use Zone Expiration : True/False toggle
Zone Expiration (Bars) : Default 500, range 1-1000
FALSE: Zones run indefinitely until broken
TRUE: Zones expire after specified number of bars
Visual result:
Expired zones look identical to broken zones
Lines become dashed and gray/silver
Fill colors remain original (green/red)
FEATURE 7: MULTI-TIMEFRAME TREND ANALYSIS TABLE
What the table shows:
A small table on your chart that monitors trend conditions across four different timeframes simultaneously.
Settings that control this:
TF1, TF2, TF3, TF4 : Four customizable timeframes
Default: 4H, 8H, 1D, 1W
Table Position : 9 positions (top/middle/bottom + left/center/right)
Text Size : Tiny, Small, Normal, Large, Huge
How trend detection works:
Uptrend Pattern : Current candle's high AND low are both higher than previous candle's high AND low on specified timeframes
This creates higher highs and higher lows
Shows consistent buying pressure
Table displays green background with upward arrow (▲)
Downtrend Pattern : Current candle's high AND low are both lower than previous candle's high AND low on specified timeframes
This creates lower highs and lower lows
Shows consistent selling pressure
Table displays red background with downward arrow (▼)
Range/Sideways Pattern : Current candle creates either inside bar or outside bar
Inside bar: Current range smaller than previous candle
Outside bar: Current range larger than previous candle
Shows market indecision or consolidation
Table displays orange background with diamond symbol (◆)
No Clear Pattern : None of the above conditions are met
Table displays gray background with horizontal line (⎯)
How to interpret the table:
All timeframes green (uptrend): Strong bullish alignment
All timeframes red (downtrend): Strong bearish alignment
Mixed colors: Conflicting timeframes, exercise caution
Mostly orange: Market in consolidation phase
Tooltip explanations: Hover over each cell for detailed description
FEATURE 8: BACKGROUND COLOR SYSTEM
What background colors show:
Optional feature that colors your chart background based on the current timeframe's trend condition.
Settings that control this:
Show Background Colors : True/False toggle
Background Transparency : 80-98% range
Default: OFF (no background colors)
Color scheme:
Green background: Current timeframe showing uptrend
Red background: Current timeframe showing downtrend
Orange background: Current timeframe showing range/consolidation
No background: No clear trend pattern
Transparency levels:
80%: More visible background color
95%: Subtle background hint
98%: Very subtle background tint

Intrabar Volume Distribution [BigBeluga]Intrabar Volume Distribution is an advanced volume and order flow indicator that visualizes the buy and sell volume distribution within each candlestick.
🔔 Before Use:
Turn off the background color of your candles for clear visibility.
Overlay the indicator on the top layout to ensure accurate alignment with the price chart.
🔵 Key Features:
Inside Bar Volume Visualization:
Each candlestick is divided into two columns:
Left column displays the sell % volume amount.
Right column displays the buy % volume amount.
Provides a clear representation of buyer-seller activity within individual bars.
Percentage Volume Labels:
Labels above each bar show the percentage share of sell and buy volume relative to the total (100%).
Quickly assess market sentiment and volume imbalances.
Point of Control (POC) Levels:
Orange dashed lines mark the POC inside each bar, indicating the price level with the highest traded volume.
Helps identify key liquidity zones within individual candlesticks.
Multi-Timeframe Volume Analysis:
The indicator automatically uses a timeframe 20-30 times lower than the current one to gather detailed volume data.
For each higher timeframe candle, it collects 20-30 bars of lower timeframe data for precise volume mapping.
Each bar is divided into 100 volume bins to capture detailed volume distribution across the price range.
Bins are filled based on the aggregated volume from the lower timeframe data.
Lookback Period:
Allows traders to select how many bars to display with delta and volume information.
The beginning of the selected lookback period is marked with a gray line and label for quick reference.
Indicator displays up to 80 bars back
🔵 Usage:
Order Flow Analysis: Monitor buy/sell volume distribution to spot potential reversals or continuations.
Liquidity Identification: Use POC levels to locate areas of strong market interest and potential support/resistance.
Volume Imbalance Detection: Pay attention to percentage labels for quick recognition of buyer or seller dominance.
Scalping & Intraday Trading: Ideal for traders seeking real-time insight into order flow and volume behavior.
Historical Analysis: Adjust the lookback period to analyze past price action and volume activity.
Intrabar Volume Distribution is a powerful tool for traders aiming to gain deeper insight into market sentiment through detailed volume analysis, allowing for more informed trading decisions based on real-time order flow dynamics.

RM StratThis is my attempt to code up the rules of "The Strat." I've seen other scripts that do parts of what my script does, but this script combines all of them into one script and allows the user control over how they interact with each other.
What's in this indicator?
Show the Strat Candle Numbers (1 - inside bar, 2 - continuation bar, 3 - outside bar) on the chart.
Show a widget off to the right of the chart for multi-timeframe analysis. This widget tells you whether the D/W/M/Q candles are currently green or red as well as the Candle type (White Circle - (1) Inside Bar, Up Green Arrow - (2U) Continuation Bar, Down Red Arrow - (2D) Continuation Bar, Green/Red Square - (3) Outside Bar)
Integrates the long and short rules into the chart. These can also be turned off if you don't want to see them. Note: this is a simplified version of these rules - if you look at the cheat sheets floating around the internet, you'll notice that all trade initiations occur on a break of the high (for longs) or low (for shorts) of the previous candle as long as that previous candle was not a 2. So that's my only rule for going long or short. I think it matches well with the cheat sheets but is way simpler to code and to think of how it works. The other benefit is it shows you failed trades that the cheat sheet won't catch - where a 2 becomes a 3 in the other direction and stops you out. You'll see that now with this script.
Ability to filter out the long/short rules based on the timeframe continuity of the higher timeframe candles. This is user-configurable so that you can experiment with timeframe continuity and see how strict you want to be with this on your trades.
Show the high/low of the Day, Week, and Month on your chart as horizontal lines that you can use as a reference. This could be used for planning profit targets or seeing how likely a reversal might indicate moving into timeframe continuity.

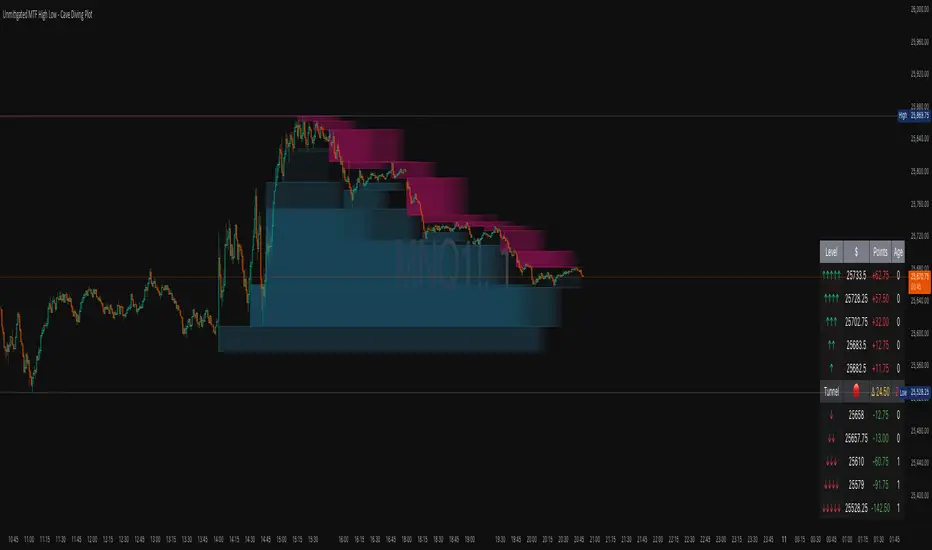
Unmitigated MTF High Low - Cave Diving Plot
IntroductionThe Unmitigated MTF High Low -
Cave Diving Plot is a multi-timeframe (MTF) indicator designed for NQ and ES futures traders who want to identify high-probability entry and exit zones based on unmitigated price levels. The "Cave Diving" visualization helps you navigate between support (floor) and resistance (ceiling) zones, while the integrated Strat analysis provides directional context.
Who Is This For?
Futures traders (NQ, ES) trading during ETH and RTH sessions
Scalpers and day traders looking for precise entry/exit levels
Traders using The Strat methodology for directional analysis
Anyone seeking confluence between price action and key levels
Core Concepts
1. Unmitigated Level:
An unmitigated level is a price high or low that has been created but not yet tested (touched) by price. These levels act as magnets - price often returns to test them.Key Properties:
Resistance (Highs): Price has created a high but hasn't revisited it
Support (Lows): Price has created a low but hasn't revisited it
Mitigation: When price touches a level, it becomes "mitigated" and loses strength
2. The Cave Diving MetaphorThink of trading as cave diving between two zones:
┌─────────────────────────────────┐
│ CEILING (Upper Band) │ ← 1st & 2nd Unmitigated Highs
│ 🟥 Resistance Zone │
├─────────────────────────────────┤
│ │
│ THE TUNNEL │ ← Price navigates here
│ (Trading Channel) │
│ │
├─────────────────────────────────┤
│ 🟢 Support Zone │
│ FLOOR (Lower Band) │ ← 1st & 2nd Unmitigated Lows
└─────────────────────────────────┘
Trading Concept:
Ceiling: Formed by the 1st and 2nd most recent unmitigated highs
Floor: Formed by the 1st and 2nd most recent unmitigated lows
Tunnel: The space between ceiling and floor where price operates
Cave Diving: Navigating between these zones for entries and exits
3. Session-Based Age TrackingLevels are tracked by session age:
Session: 6:00 PM to 5:00 PM NY time (23-hour window)
Age 0: Created in the current session (today)
Age 1: Created 1 session ago (yesterday)
Age 2+: Older levels (more significant)
Why Age Matters:
Older unmitigated levels are typically stronger magnets
Fresh levels (Age 0) may be weaker and easier to break
Age 2+ levels often provide high-probability reversal zones
Indicator Components
Visual Elements
1. Colored Bands (Cave Zones)Upper Band (Pink/Maroon - 95% transparency)
Space between 1st and 2nd unmitigated highs
Acts as resistance zone
Price often hesitates or reverses here
Lower Band (Teal - 95% transparency)
Space between 1st and 2nd unmitigated lows
Acts as support zone
Price often finds buyers here
2. Information Table Located in your chosen corner (default: Bottom Right), the table displays:
5 most recent unmitigated highs (top section)
Tunnel row (middle separator)
5 most recent unmitigated lows (bottom section)
Reading the TableTable Structure
┌────────┬──────────┬────────┬───────┐
│ Level │ $ │ Points │ Age │
├────────┼──────────┼────────┼───────┤
│ ↑↑↑↑↑ │ 21,450.25│ +45.30 │ 3 │ ← 5th High (oldest)
│ ↑↑↑↑ │ 21,425.50│ +32.75 │ 2 │ ← 4th High
│ ↑↑↑ │ 21,410.00│ +25.00 │ 1 │ ← 3rd High
│ ↑↑ │ 21,400.75│ +18.50 │ 1 │ ← 2nd High
│ ↑ │ 21,395.25│ +12.00 │ 0 │ ← 1st High (newest)
├────────┼──────────┼────────┼───────┤
│ Tunnel │ 🟢 │ Δ 85.50│ 2U │ ← Current State
├────────┼──────────┼────────┼───────┤
│ ↓ │ 21,310.00│ -15.25 │ 0 │ ← 1st Low (newest)
│ ↓↓ │ 21,295.50│ -22.75 │ 1 │ ← 2nd Low
│ ↓↓↓ │ 21,280.25│ -30.00 │ 1 │ ← 3rd Low
│ ↓↓↓↓ │ 21,265.75│ -38.50 │ 2 │ ← 4th Low
│ ↓↓↓↓↓ │ 21,250.00│ -45.00 │ 3 │ ← 5th Low (oldest)
└────────┴──────────┴────────┴───────┘Column
Breakdown
Column 1: Level (Arrows)
Green arrows (↑): Resistance levels above current price
Red arrows (↓): Support levels below current price
Arrow count: Indicates recency (1 arrow = newest, 5 arrows = oldest)
Why This Matters:
More arrows = older level = stronger magnet for price
Column 2: $ (Price)
Exact price of the unmitigated level
Use this for limit orders and stop placement
Column 3: Points (Distance)
Positive (+) for highs: Points above current price
Negative (-) for lows: Points below current price
Helps gauge proximity to key levels
Trading Application:
If you're +2.50 points from resistance, a reversal may be imminent
If you're -45.00 points from support, you're far from the floor
Column 4: Age (Sessions)
Number of full 6pm-5pm sessions the level has survived
Age 0: Created today (current session)
Age 1+: Created in previous sessions
Significance Ladder:
Age 0: Weak, may break easily
Age 1-2: Medium strength
Age 3+: Strong, high-probability reaction zone
Tunnel Row (Critical Information)│ Tunnel │ 🟢 │ Δ 85.50│ 2U │
└─┬─┘ └─┬─┘ └──┬──┘ └─┬─┘
│ │ │ │
Label Direction Range Strat
1. Tunnel Label: Identifies the separator row
2. Direction Indicator (🟢/🔴)
🟢 Green Circle: Current 15m bar closed bullish (above previous close)
🔴 Red Circle: Current 15m bar closed bearish (below previous close)
3. Δ (Delta/Range)
Distance in points between 1st High and 1st Low
Shows the tunnel width (trading range)
Example: Δ 85.50 = 85.50 points between ceiling and floor
Trading Use:
Wide tunnel (>100 points): More room to trade, consider range strategies
Narrow tunnel (<50 points): Tight range, expect breakout
4. Strat Pattern
1: Inside bar (consolidation)
2U: 2 Up (bullish directional bar)
2D: 2 Down (bearish directional bar)
3: Outside bar (expansion/volatility)
Color Coding:
Green: 2U (bullish)
Red: 2D (bearish)
Yellow: 3 (expansion)
Gray: 1 (inside/neutral)
RT-Signal LiteRT-Signal Lite — Learning & Price-Action Companion (EN)
Protected script – source code is not visible. Educational tool for learning structured entries, filters and risk management.
What it is
RT-Signal Lite is a learning-first price-action indicator that helps you turn chart context into repeatable entries. It combines a score engine (trend, momentum, volume, divergences) with optional pattern/structure filters, a clear signal panel, and a visual TP/SL ladder in R-multiples.
How it helps you learn
• Practice exact entry logic (Cross/Pullback/Breakout with optional Retest).
• See why a setup is allowed or blocked (FVG/HTF proximity, ADX/DI, Volume Z, Liquidity sweep etc.).
• Train risk thinking with R-based TP ladder, BE/Trailing, “SL-Fishing” concept and a compact monthly performance table (educational only).
• Multi-TF RSI panel + simple market labels keep the big picture in view.
• Works great in Replay mode for bar-by-bar drills.
Quick start
Pick a supported timeframe (3/5/15/30/45/60/240/D by default; or add your own in Settings → Timeframe-Gate).
Choose an Entry Mode : CrossOnly / Pullback / Breakout (with ATR buffer) / Retest / Any.
Keep default risk presets (ATR or Structure SL, TP1 in R, step in R, optional BE/Trailing).
Read the Signal Box : direction, Entry/SL/SL-Fishing, TP1…TPn, status, VIX/VDAX state, score & confidence.
Use Trend Box for MTF RSI and a quick checklist (Breakout, Volume OK, Divergence, VIX allowed).
Train in Replay → journal your decisions.
Main features (Lite)
• Entry engine : SMA cross, EMA pullback bounce, prior HH/LL breakout with ATR buffer, optional strict Retest window; candlestick assists (Hammer/Shooting Star, Engulfing, Morning/Evening Star, Doji, Inside Bar, 3 Soldiers/Crows).
• Filters : ADX/DI thresholds (TF-aware), Volume (level & Z-score), RSI divergences (pivot-anchored), ATR/Close regime, FOMO-bar guard, Liquidity sweep window, Opposite Order-Block distance, FVG zone gating, HTF zone proximity, optional VIX/VDAX gate (auto picks VDAX for DAX).
• Structure : Support/Resistance lines, classical FVG (lifetime & mitigation), robust Order-Blocks with separate states and mitigation logic.
• Scanners : Triangle breakout (Lite).
• Risk & exits : Structure/ATR SL, SL-Fishing buffer, TP ladder in R (TP1…TPn), optional BE & Trailing after TP1, cooldown, max bars in trade.
• UI : Signal Box, Trend Box, local trade boxes/lines (entry/sl/tp), watermark, monthly performance table (one outcome per trade: highest TP or SL-Fishing; counted by exit/entry month – for learning only).
• Alerts : Alerts are available in PRO only.
• Privacy : Compiled & protected; source code is not visible.
Key inputs (short list)
Entry mode • Breakout ATR buffer • Retest window/strict • Pullback bounce •
Risk: min R:R, Structure/ATR SL, ATR multiplier, TP ladder, BE/Trail, Cooldown •
Filters: ADX/DI, Volume/Z, ATR regime, RSI limits, FVG/HTF gates, Liquidity sweep, Opp. OB distance •
Scanners: Triangle (Lite) • RSI-MTF toggles • Visuals (Signal/Trend boxes, SR, OB/FVG).
Markets & timeframes
Indices (US/DE), commodities, crypto, forex, stocks.
Works on the whitelisted/custom TFs (e.g., 3/5/15/30/45/60/240/D). Heikin-Ashi and some feeds may change results; volume-based filters need reliable volume.
Best practice (learning workflow)
• Start with 5m/15m/1h on liquid symbols.
• Train in Replay: define entry, see blockers, adjust rules, collect screenshots.
• Move to live observation (paper/sim) only after you can explain every entry/avoidance.
• Use strict risk: position sizing to SL, no over-optimization, no promises.
FAQ — “No signal?” (common blockers)
TF not allowed • Cooldown active • ADX/DI below threshold • VIX/VDAX gate off •
Retest not hit yet • FVG/HTF gate blocking • FOMO bar filtered • Min R:R to next level not met • Opposite OB too close • Liquidity sweep window not satisfied.
PRO upgrade
Adds alerts and extra scanners (Range/Channel/Double-Top/Bottom), more visualization and flexibility. Links are provided inside the script under Settings → Info .
Disclaimer
For educational purposes only. No financial advice. No performance guarantee. Always validate signals in context (structure, liquidity, volatility, news). You are fully responsible for your decisions and risk.

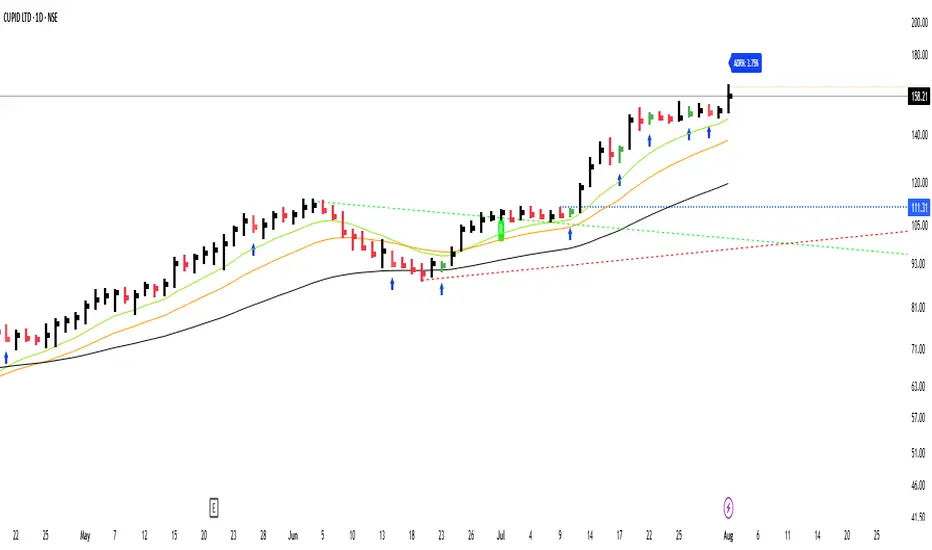
GS_QuantEdgeGS_QuantEdge is a focused swing trading tool built for traders who seek tight entries and high risk-reward setups.
What it includes:
ATR-Based Trendlines:
Automatically plots dynamic upper and lower levels using pivots and ATR-based slope logic. Helps define key price zones where reactions or breakouts are likely.
Inside Bar Detection:
Identifies inside bar candles with subtle blue arrows below the bar and colors the candle — ideal for spotting low-risk compression setups before potential expansion.
ADR% Volatility Label:
Displays the Average Daily Range as a percentage of the current price, helping you assess volatility and optimize position sizing.
EMA Overlay (11, 21, 50):
Plots essential EMAs directly on the chart to observe trend structure and alignment, aiding in identifying high-probability trade zones.
High/Low Flags (hidden by default):
Marks new 11-bar, 21-bar highs and 52-bar lows to signal momentum or exhaustion. Helpful for observing if price is making new highs/lows on different timeframe scales.
How it helps:
This indicator gives swing traders a clean, structured chart view — highlighting areas of compression, breakout zones, and volatility conditions. Whether you're entering early on tight setups or waiting for confirmation, GS_QuantEdge helps you stay focused on well-defined opportunities with optimal risk-to-reward potential.
Active Ranges Detector
1. Purpose
The script identifies and manages bar ranges, which are defined as bars where the high and low prices are fully contained within the high and low of the previous bar. These ranges are used by traders to identify potential breakouts and price consolidations.
2. Key Features
Active Range Validation
A potential range becomes an active range when the price breaks out of the bar’s high or low. The breakout direction is tracked:
• Upward breakout: When the price closes above the high of the range.
• Downward breakout: When the price closes below the low of the range.
The script creates:
• Lines to represent the high and low of the range.
• A colored background box to indicate the range, with color coded for breakout direction:
• Green: Upward breakout.
• Orange: Downward breakout.
Range Updates
• Exit Detection: The script detects if the price exits the range (moves outside the high or low levels).
• Reintegration and Mitigation:
• If the price re-enters an exited range, it marks the range as “mitigated.”
• The lines for mitigated ranges are updated (color and width are changed).
• The background box is removed for mitigated ranges.
3. User Inputs
The script provides customization options:
• Breakout Colors:
• upBreakoutColor: Background color for upward breakout ranges (default: semi-transparent green).
• downBreakoutColor: Background color for downward breakout ranges (default: semi-transparent orange).
• Mitigated Range Styling:
• mitigatedLineColor: Line color for mitigated ranges (default: red).
• mitigatedLineWidth: Width of the line for mitigated ranges.
• Line and Background Settings:
• activeLineWidth: Width of lines for active ranges.
• lineExtension: Length of line extensions beyond the range’s initial boundaries.
• Range Display Limits:
• maxActiveRanges: Maximum number of active ranges to display on the chart (default: up to 200).
4. Visualization
The script provides clear visual feedback for identified ranges:
• Lines: High and low levels of the range are drawn as lines on the chart.
• Background Boxes: Colored boxes are drawn to represent active ranges, with breakout direction indicated by the box’s color.
• Mitigation Styling: Mitigated ranges have updated line styles and no background.
5. Range Management
The script actively manages ranges:
• Tracks the status of each range (active, exited, reintegrated, mitigated).
• Limits the number of displayed ranges to improve chart readability and comply with TradingView’s object limits.
6. Use Case
This script is ideal for traders who:
• Use inside bars to identify areas of consolidation and breakout opportunities.
• Want to track active and mitigated ranges automatically.
• Need a clear, visual representation of ranges and breakout directions.
7. Limitations
• Inside bars are identified based only on the current and previous bar, so the script might not detect more complex consolidation patterns.
• The maximum number of ranges displayed is limited to the user-defined value (maxActiveRanges), with a hard limit of 200 due to TradingView’s object restrictions.

Tweak Strat Candle ColorThis script allows traders to customize candlestick colors based on The Strat trading system developed by Rob Smith.
The script determines if the current candle is an inside bar (1), outside bar (3), directional up (2u) , or directional down (2d).
An inside bar is a candle that trades fully within the previous candle.
An outside bar breaks both the high and the low of the previous candle.
A directional up bar breaks the high of the previous candle but NOT the low of the previous candle.
A directional down bar breaks the low of the previous candle but NOT the high of the previous candle.
The trader can modify the colors they wish to use in the settings menu.
NOTE: You must select "Visual order - Bring to front"
If you do not, the custom colors will disappear when you click the chart window.

Candlestick Pattern Detector - Aitch-TThis script detects the following candlestick patterns:
Bullish Patterns:
- Normal 3 Bar Fractal
- Enhanced 3 Bar Fractal
- Engulfing
- Harami ( Inside bar )
- Bullrami (Altenate Bull Harami)
Bearish Patterns:
- Normal 3 Bar Fractal
- Enhanced 3 Bar Fractal
- Engulfing
- Harami ( Inside bar )
- Bearami (Alternate Bear Harami)
- Shooting Star
How it works:
- When you add the script to your chart, green and red dots will appear at the top and the bottom of the chart.
- Red dots at the top of the chart point out the candles that have completed a bearish pattern .
- Green dots at the bottom of the chart point out the candles that have completed a bullish pattern .
How to use:
Use it in conjunction with other analysis tools ( Fibonacci Retracements, Histogram, Willy, RSI , volume , etc) to determine high probability levels.

ck - Inner Bars Indicator with Alerts and Trailing Stop v1*** Please check out the matching Strategy to accompany this Indicator to allow you to fully backtest! ***
Inner Bar trading strategy is where the "inside" bar (or candle to the right) within a pair is smaller and within the high to low range of the prior bar, as this pattern tends to be somewhat predictable; especially in "chop" or sideways trading, it is useful to have in your tool box.
Features include:
Complimentary strategy you can add as well as the indicator to backtest and tune your settings before live trading
Trailing Stoploss to wring every cent from a trade
Clear Alert labels have been coded in for use with trading bots, 3commas is recommended.
Enable/Disable Shorts in addition to Longs
Visual chart shapes - Pink Triangle = Long, Purple Triangle = Short, Thin Green Arrow = Profit, Thin Red Arrow = Loss
Realtime Deal Status - Plotlines include Yellow = Entry Price, Green = Trailing Stop Profit, Red - Hard Stoploss
A further feature is that you can disable Shorts (therefore only Longing) for use with exchanges
that only allow you to Long, such as Binance & Coinbase.
Additionally, this Indicator will close a trade before opening the next, so a single exchange
account (BitMEX for example) is all that is required versus having separate accounts to long or
short on the same chart.
This strategy is intended to use $100 of capital, traded at 2.5% per order with 10x lev on Bitmex.
If you like my work, please use my referral links (you will receive discounts!)
3commas trading bots (now with Bitmex support and a lot more!) - 3commas.io
BitMEX - www.bitmex.com
If you have any comments or suggestions, please message me via TradingView.
Based on the core "Inner Bars" concept found at:
backtest-rookies.com
with original inspiration/idea from babypips.com

CRT + Daily Bias - Milana Trades
This indicator merges Candle Range Theory (CRT) with a Daily & Weekly Bias model, offering traders a complete view of both short-term price traps and higher-timeframe market direction. It is designed to highlight potential liquidity traps, reversals, and directional bias in a structured and visually intuitive format.
🔹 1. Candle Range Theory (CRT)
The CRT module detects false breakout candles (trap candles) and plots key high/low levels to mark significant turning points.
Bullish CRT
Occurs when price makes a lower low than the previous candle but closes bullish (close > open).
→ Suggests a possible upside reversal.
Bearish CRT
Occurs when price makes a higher high than the previous candle but closes bearish (close < open).
→ Suggests a possible downside reversal.
When a CRT is detected:
Dotted lines and levels are drawn from the trap candle’s high/low.
Labels such as CRT, CRT H, and CRT L appear for easy visualization.
Previous CRT structures can auto-clear when new traps form.
Alerts trigger once a trap is confirmed on candle close.
🔹 2. Daily & Weekly Bias
The Bias module determines market direction using daily and weekly candle structure. It evaluates:
Breaks above/below previous highs and lows.
Failed breaks (false moves beyond prior levels).
Inside bars (neutral range conditions).
Bias Logic Summary:
Close Above Previous High → Bullish
Close Below Previous Low → Bearish
Failed Break Above → Bearish
Failed Break Below → Bullish
Inside Range → Neutral
Both Daily and Weekly bias values are displayed in an on-chart table for quick context.
⚠️ Note:
The bias readings are technical references, not trading signals. Always combine them with your own analysis, context, and market awareness.
🔹 3. Bias Table
A clean table (top-right by default) displays:
Timeframe (Daily / Weekly)
Current Bias (Bullish, Bearish, Neutral)
Reason for bias (breakout, failure, or inside bar)
The table is fully customizable, allowing you to adjust:
Header and text colors
Background and border styles
Display of specific timeframes (Daily / Weekly)
🔹 4. Alerts
Real-time alerts notify you when:
Bullish CRT is detected
Bearish CRT is detected
Alerts only trigger on candle close for accuracy and reduced false signals.
🔹 5. Settings
CRT Module
Length: Number of bars CRT levels extend.
Clear Broken: Automatically removes old CRT levels when new traps form.
Trap Candle Colors: Customize bullish/bearish candle highlights.
Line & Label Style: Full control of label size, color, and line styling.
Bias Module
Show Table: Toggle on/off.
Show Daily / Weekly Bias: Select which to display.
Color Customization: Set colors for bias states and table design.
🔹 6. How to Use
Watch for CRT labels forming near major or liquidity areas.
Check the Daily/Weekly Bias Table for trend confirmation.
Align CRT signals with the bias direction for higher-probability setups.
Use alerts to stay informed without constantly monitoring charts.
